Global Extreme Heat

AP analysis: Exposure to extreme heat has tripled since 1983
A new dataset highlights the number of people on Earth exposed to dangerously hot weather
World leaders have committed to limiting Earth's rising temperature to 1.5 degrees Celsius (2.7 degrees Fahrenheit) above pre-industrial times.
But what does that feel like?
It's difficult to convey, because we regularly experience greater temperature changes throughout the day.
But while you may not directly feel a rise in the average global temperature, you can still experience its impacts. One of the most noticeable impacts: days when it’s extremely hot. As the global average temperature rises, so do the hottest daily temperatures. And, in some places, the hottest days can be dangerous to human health, causing heat stress.
Heat stress can create a host of health problems, including rashes, cramps and heat stroke. Hot air is not the only risk factor for it. Other factors include humidity, wind speed and the amount of shade.

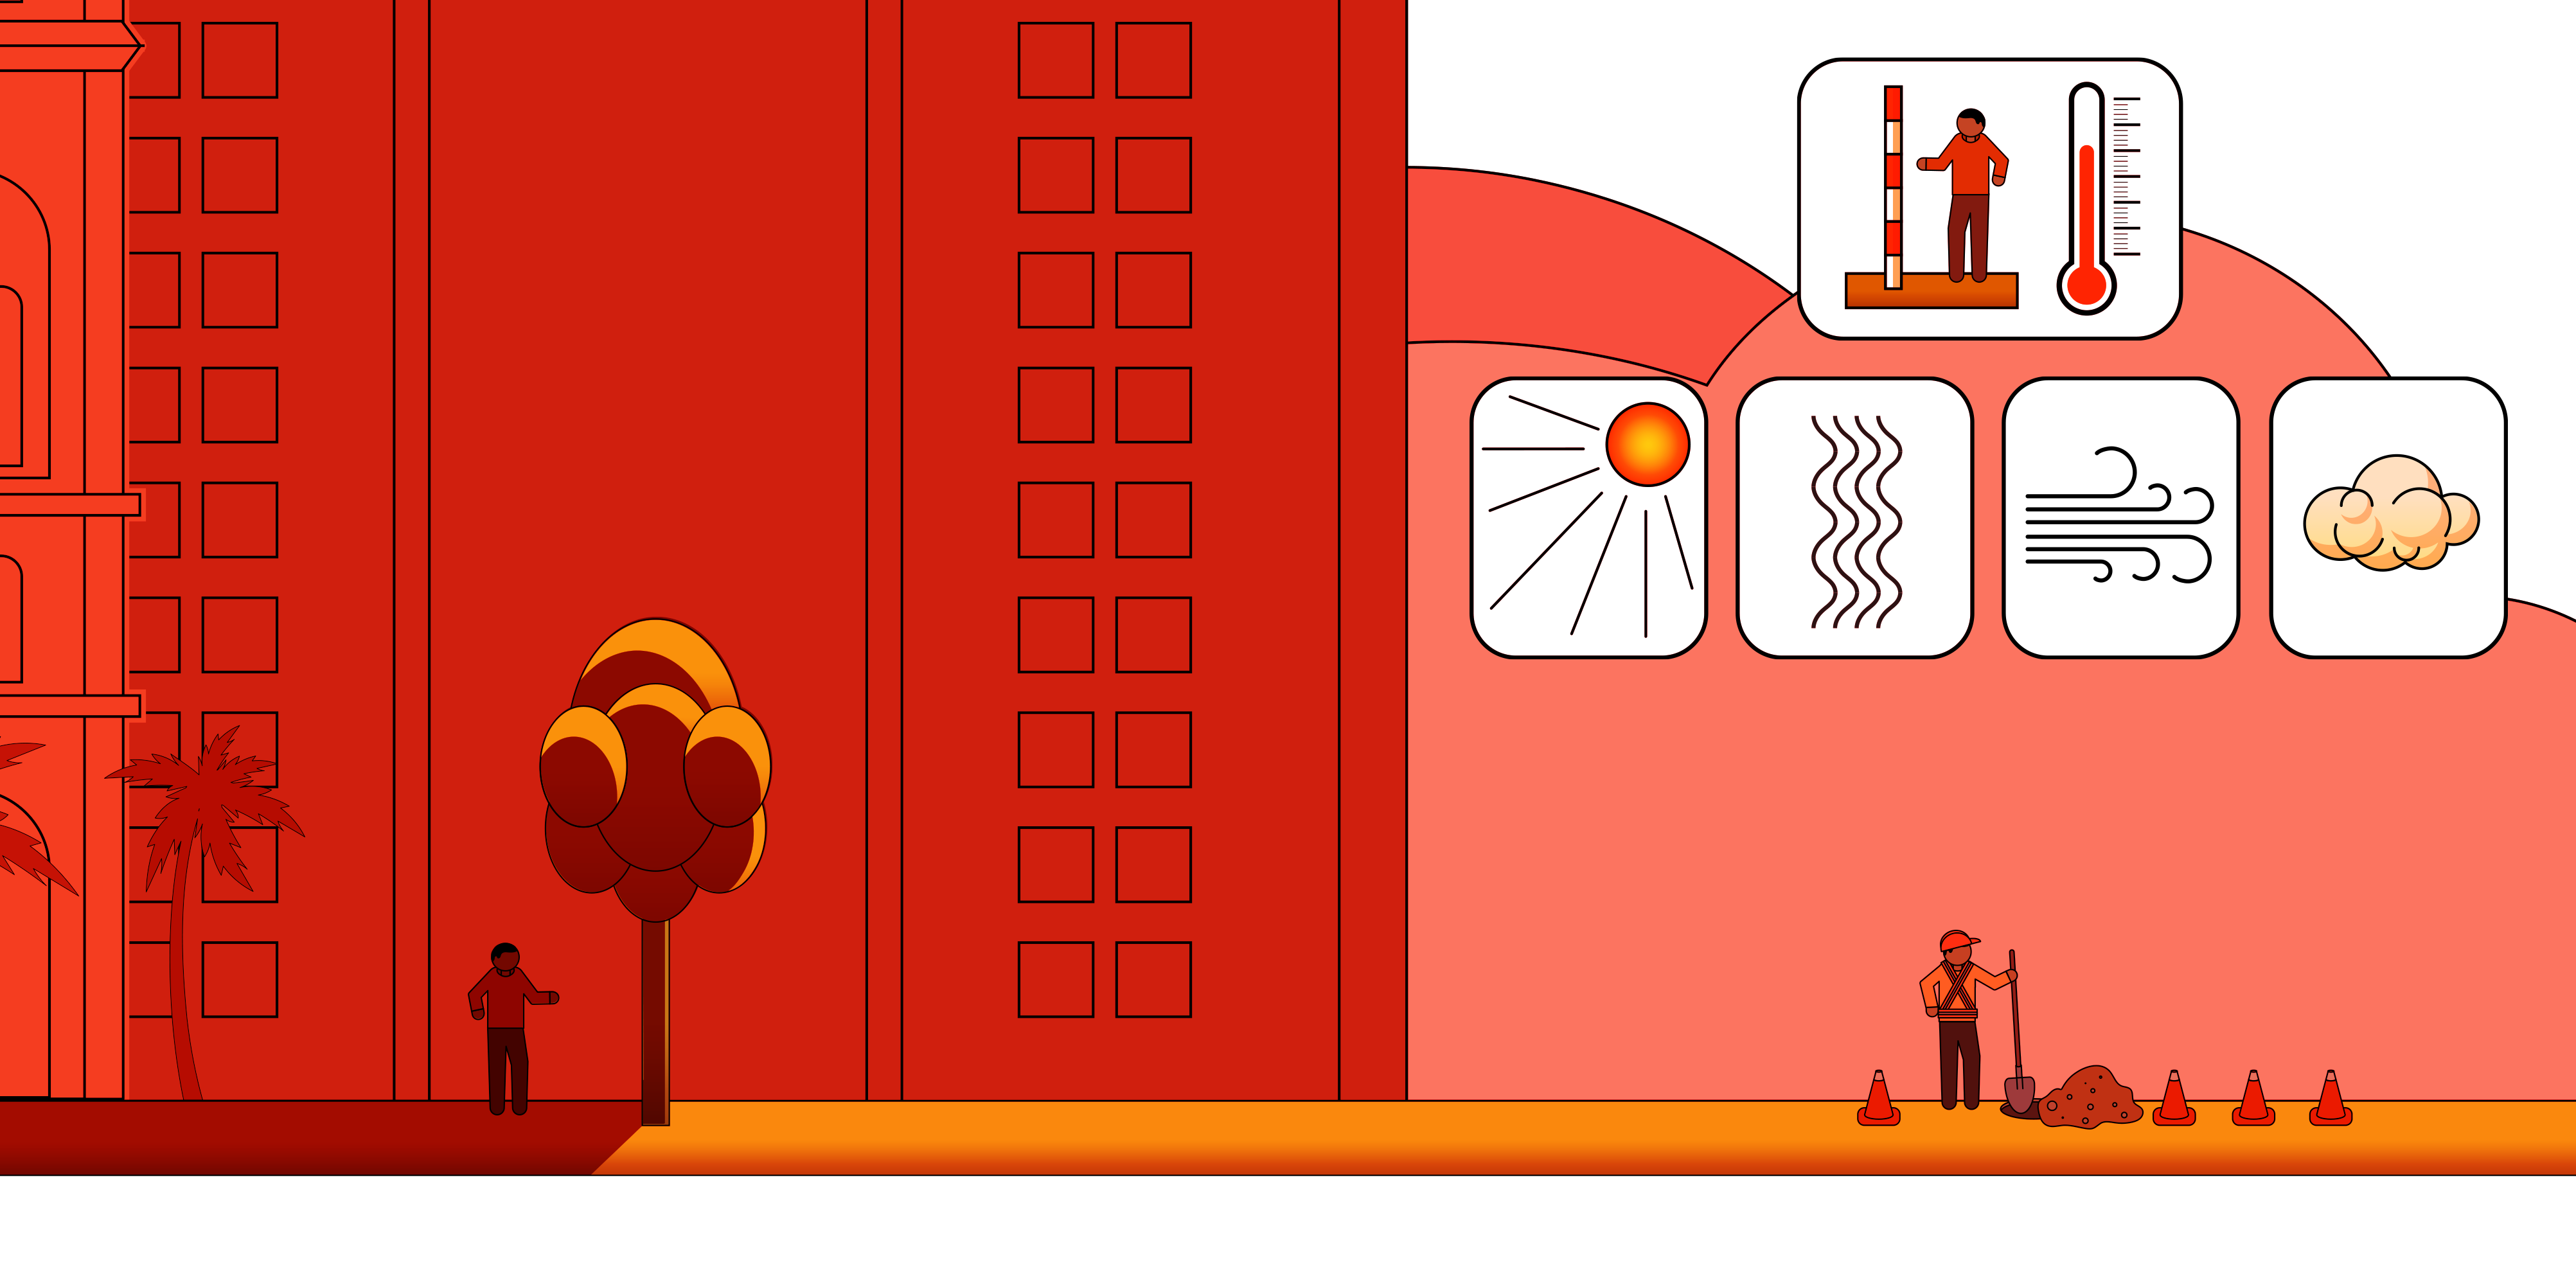
You may be familiar with the heat index, which takes into consideration temperature and humidity to suggest what it feels like in the shade on a hot day. But even the heat index doesn’t tell you what it’s like to be working in the full sun on an extremely hot windless day.
Increasingly, climate scientists and meteorologists are advocating for the use of a different metric for understanding extreme heat. It’s called wet-bulb globe temperature and it takes into account temperature, humidity, wind speed, sun angle and cloud cover.
To better understand where humans are most at risk from heat stress, Columbia University’s climate school recently published a global dataset with estimates of both population and wet-bulb globe temperature. The dataset spans 33 years, from 1983 to 2016.
“It's focused on understanding daily extremes with a specific focus on human health outcomes,” said Cascade Tuholske, a Columbia research scientist.
The Associated Press analyzed the data and found that exposure to extreme heat has tripled and now affects about a quarter of the world's population.
This map is a snapshot of the temperature data. Produced by the Climate Hazards Center at the University of California, Santa Barbara, it shows the number of days in 2016 when the wet-bulb globe temperature exceeded 30 degrees Celsius. That’s the temperature at which people are advised to start taking rests if they’re working outdoors.
This map provides a clear view of where on Earth temperatures reached dangerous levels. But it's missing a key component — where people actually live.
To match heat measures with population estimates, the researchers averaged temperature data over 13,115 urban centers identified in a dataset produced by the European Union.
Out of the 13,115 urban centers around the world, nearly half experienced an increasing trend in heat exposure.
In 2016, just under 1.7 billion people lived in those areas, with the majority in Asia and sub-Saharan Africa.
The most affected region, by far, was southern Asia, where India alone accounted for 37% of the population living in areas with an increasing extreme heat trend.
With population growth from 1983 to 2016 for each city...
...and estimates for the year-to-year increase in annual counts of dangerously hot days, the AP was able to identify the cities in the world where exposure to extreme heat is increasing most.
In Dhaka, Bangladesh, for example, the population more than tripled from about 7.7 million in 1983 to 24 million in 2016. While the city grew by more than 16 million people, the number of extreme heat days also increased by 1.5 days a year, until Dhaka experienced about 50 more dangerously hot days a year than it did in 1983. This large population growth, along with the warming trend for the area, reveals that Dhaka had the biggest increase in heat exposure in the world.
Population growth and increasing temperature both contribute to exposure trends. In some cases, these have an equal effect. That was the case in Kolkata, India, where the population grew by 6 million people and the number of hot days grew by 1.76 each year. Both of these increases contributed to a steep exposure trend.
Meanwhile, New Delhi added nearly 14 million people. While the city added 1.12 additional hot days each year, the population increase is what made Delhi's exposure trend the steepest in India.
This dataset focuses on the past, but could help world leaders make more informed decisions in the future. Indonesia is planning to move the country’s capital from Jakarta – a city that is sinking below sea level – to Kalimantan. The development site is in an area of jungle between two cities, Samarinda and Balikpapan. Both cities have increasing heat exposure trends.
People in Balikpapan, located at the mouth of the Bakpapan Bay, could expect 10 more days of extreme heat in 2016 compared with 1983.
Samarinda, situated on the humid Mahakam River delta, could expect 19 more days. Jakarta, although sinking, did not register a significant increasing exposure trend in the dataset.
Since an extreme heat event means the wet-bulb globe temperature reached at least 30 degrees Celsius, most urban centers with significant exposure trends are located around the equator and the tropics. However, as the climate warmed, cities farther from the equator saw more extreme heat.
For example, Mokpo, located in South Korea, didn't register an extreme heat event until 2013, when it experienced three. Another event followed in 2015, and in 2016 there were two. Cities like Mokpo that are just now experiencing dangerous heat more regularly are at risk of being caught unprepared.
Elsewhere, cities that already experience extreme heat are growing rapidly in population.
Douala, Cameroon, grew from roughly 760,000 people in 1983 to nearly 3 million in 2016. United Nations population projections suggest that count will double by 2035. Douala’s citizens endured 76 days of extreme heat in 2016.
Douala is representative of sub-Saharan Africa as a whole. According to the 2019 U.N. World Population Prospects, most of the world's population growth will come from sub-Saharan Africa in the coming years. Warming trends are increasing in cities there, and as global average temperatures keep rising, the people in this part of the world will likely feel the increase in heat exposure most.
Dim Coumou, a climate professor at Vrije Universiteit Amsterdam, said the combination of growth in African cities and climate change presents a serious risk. “As the population increases in these megacities, you have more buildings, more concrete and an increased heat-island effect, making the heat waves worse,” Coumou said. “I think it’s a dangerous combination.”
One of the highlights of the dataset is its ability to provide exposure estimates for places like sub-Saharan Africa — where weather stations and reliable census counts are sparse.
“If we don't have any information about a problem, we can't do anything about it,” Tuholske said, “even if we see it all around us.”